Scientific journals are under significant pressures to attract high-quality articles, curate them, and ensure their dissemination. As journals experiment with new strategies to optimize their performance—expedited processing, online-only publication, open access, video summaries, transparent reviews, prepublications prints, concurrent releases, social media investments—the visual abstract provides several lessons learned for journals and editors to make their upcoming efforts more effective.
Journals have a long history of using images to bring attention to their articles. For example, the central illustration1 was created as a visual entryway to an article, with a summarizing key image. Similarly, graphical abstracts also brought a visual summary of research articles. The visual abstract was a subsequent development I created in 2016 that brought distinct features to the visual summary of research articles (Figure 1):
- Reproducible templated layout tailored to study design and outcomes
- Silhouetted, solid icons
- Use of monochromatic colors with black text
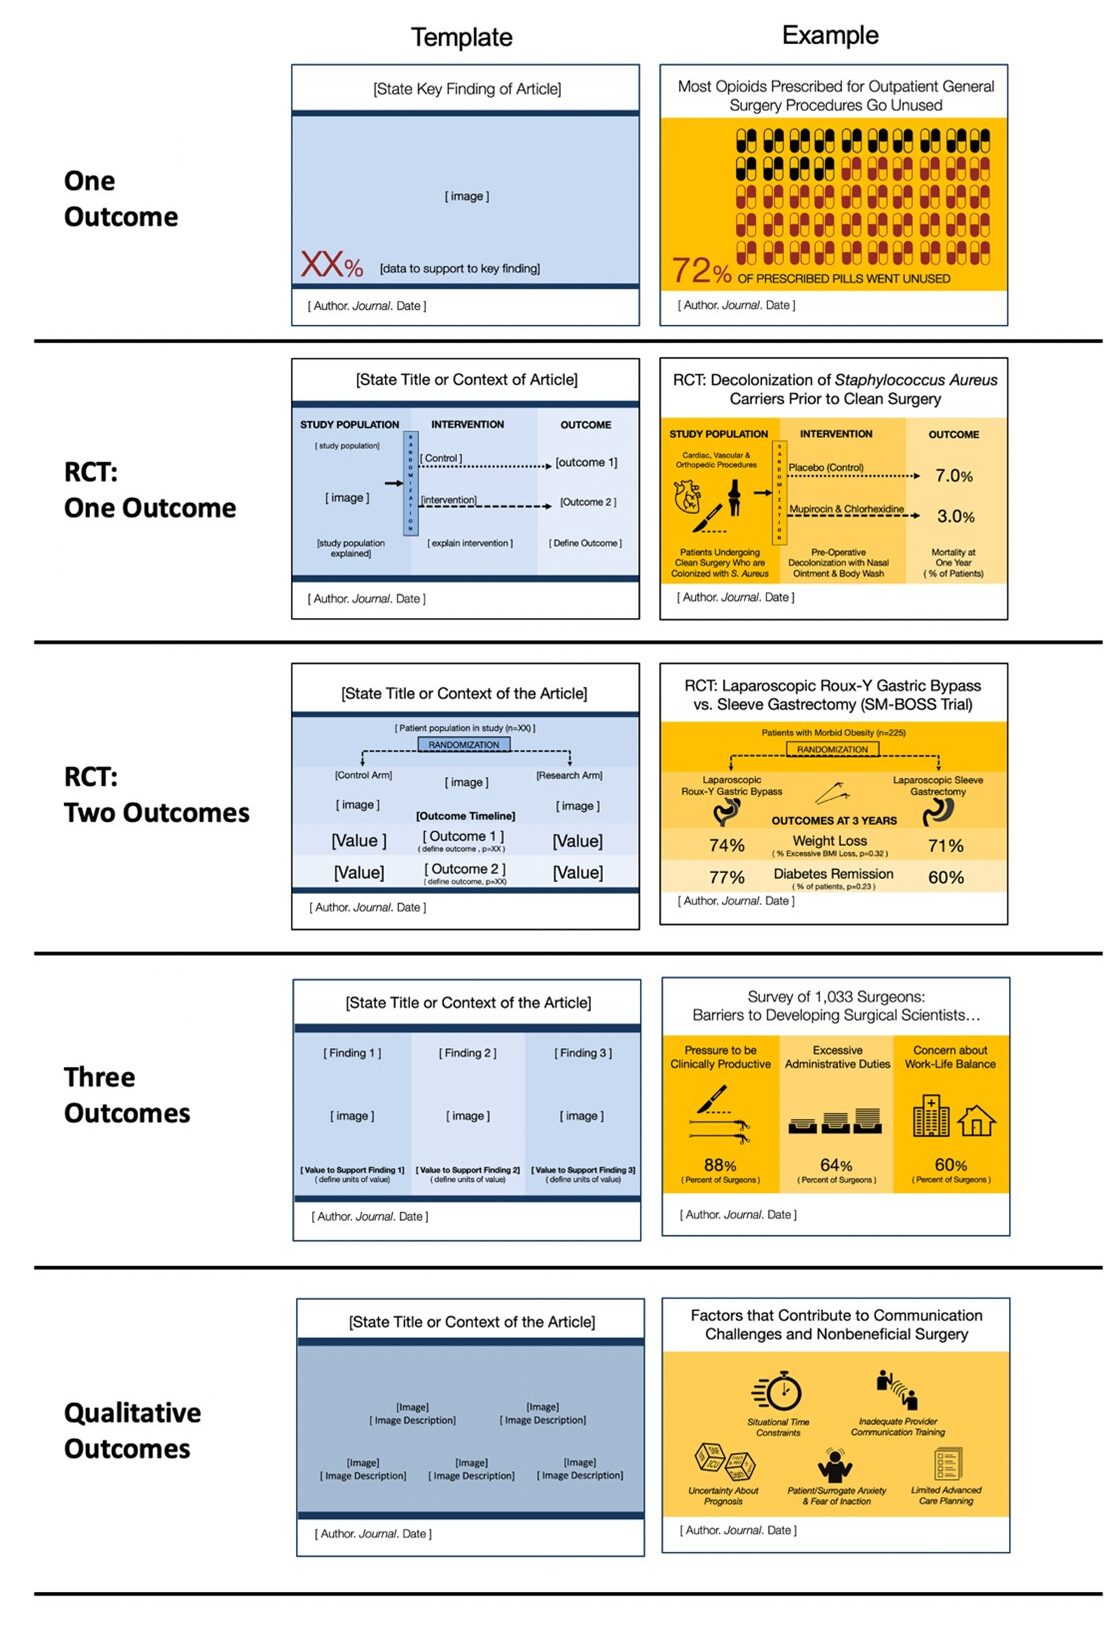
The templates were made open source and since 2016, more than 100 journals and institutions have adopted them in their dissemination strategy.2-15 Several journals and institutions now showcase their visual abstracts in dedicated libraries, including those from the Centers for Disease Control and Prevention,16 the New England Journal of Medicine,17 and The Journal of the American Medical Association.18 While each has added their own branding and style (e.g., addition of more colors, proprietary images), they generally follow the same templated layouts.
The appeal of adopting the visual abstract was not just aesthetic. To date, multiple prospective randomized trials have demonstrated the visual abstract to be a superior dissemination strategy compared to text or other images.3,15,19,20 In the original trial, the visual abstract led to articles being read nearly 3 times as often.3
While the visual abstract has been written about extensively (including broader applications beyond research dissemination to direct clinical care21), it also provides a number of illustrative lessons learned for journal editors that I summarize below.
Great Ideas Should Be Shared
As soon as it became clear that the visual abstract represented a novel and compelling strategy to disseminate research, an important decision needed to be made: would this be a proprietary tool limited to 1 journal or would it be an open source for iterative improvement and collaboration? As the developer of the visual abstract, I am thankful I chose the latter because it allowed for important growth and expertise to develop. For example, the first visual abstract primer was written by a single author and totaled 9 pages, while the most recent version22 has 12 authors bringing their unique expertise to more than 50 pages of guidance. Without question, I would not have identified several of the innovations described by others (e.g., the “methods bar” by Dr Chelsea Harris,23 see example here24) on my own.
Design (Usually) Cannot Be Delegated
Once the visual abstract gained popularity, the obvious question arose: how do you create one? While I led several workshops around the world, recorded YouTube videos25 and updated the visual abstract primer, many journals struggled.10,11,27,28 Namely, many journals assumed that authors of scientific articles were also equipped with design sensibilities. As such, many journals began requiring authors to submit visual abstracts. The results of that requirement came through in a recent systematic evaluation of 25 academic journals that adopted the visual abstract and ranked them based on their design quality.28 There was notable variability, with many journals consistently lacking the needed design quality to make the visual abstract effective. In the accompanying editorial,26 a call was made to reconsider the requirements unless journals can provide design support for authors.
Rapid Adoption Needs Investment in Quality Control
As many journals began adopting the visual abstract, a few started to recognize the need for quality control. Notably, journals made investments in the visual abstract, including designated visual abstract editor roles and in-house designers. The benefits of these types of investments were three-fold. First, this often led to added diversity among editorial boards, as the visual abstract editor in most journals was someone early in their career who otherwise would not have a role on the board. Second, these standardized roles were often created in parallel to templated guidance that helped ensure a minimum level of quality and accuracy for each visual abstract. Third, support from journals to execute a visual abstract helped counter resentment from authors who felt they were being asked to take on a task they were not equipped to perform. Although many authors have taught themselves or taken formal courses to create visual abstracts, journals still need to place safeguards and curate visual abstracts, just as they would article content, with guidelines and processes.5,14,26,27,29 Some best practices and guidelines are summarized in the Table.
Table. Resources to create and improve visual abstracts.
|
Resource |
Source | Description | URL |
| Visual Abstract Primer (4th edition) | Andrew M Ibrahim | Full PDF guide to creating a visual abstract, written by multiple journal editors | https://www.SurgeryRedesign.com/resources |
| What is a Visual Abstract? And how to Create One? | Andrew M Ibrahim | Video summarizing the history of the visual abstract, its broad applications, and an introduction to creating one | https://youtu.be/bOXSNCjXAKg |
| Visual Abstracts | The Centers for Disease Control and Prevention (CDC) | Best practice advice and examples from the CDC | https://www.cdc.gov/pcd/for_authors/visual_abstracts.htm |
| Visual Abstract for Beginners | American Association of Hip & Knee Surgeons | Beginner walk-thru of creating a visual abstract | https://www.youtube.com/watch?v=e4Ani6SKakg |
| Visual Abstract Design Resources | Elsevier | Index of design and guideline resources for creating a visual abstract | https://researcheracademy.elsevier.com/uploads/2022-11/Resources%20for%20visual%20abstract%20by%20RA_Nov2022.pdf |
| Visual Abstract Scoring Rubric | Annals of Surgery | Design and accuracy rubric to evaluate visual abstract quality | https://pubmed.ncbi.nlm.nih.gov/35801709/ |
No Substitute for Excellent Content
Over my career, I have been asked to create visual abstracts for articles and refused. While the visual abstract can enhance and elevate a manuscript, it is no substitute for excellent writing. Articles that are poorly written, do not have clear outcomes, lack consistency throughout the section, or simply lack rigor will not do well as visual abstracts. In other words, the easiest way to successfully disseminate a research article is to first have an excellent, rigorous, well-written article. More and more, I find myself editing the text of visual abstracts rather than images to facilitate article dissemination. For all the important tools we explore for article dissemination, great science and writing remains foundational.
Clarify the Need You Are Trying to Address
Why has the visual abstract been successful? It fills multiple needs. First, modern audiences are far more visual, with shorter attention spans. In our early pilot work, we found that visual abstracts could be comprehended in less than 10 seconds compared with about 75 seconds for text abstracts. In doing so, the abstracts resonated with busy readers who just needed concise previews of articles before deciding what to read. Second, modern audiences are flooded with unprecedented waves of information screaming for their attention. The visual abstract contrasts those signals with a clear and accessible message, which paradoxically made it stand out. In fact, as seen in Figure 1, part of the monochromatic color schemes was to stand out with simplicity. Third, readers of research articles often also present work themselves. The visual abstract is an easy “ready-made slide” for a presenter to use in a talk (Figure 2). In other words, the visual abstract fulfills a day-to-day need of many readers.

Your Audience May Be Broader Than Anticipated
One of the earliest surprises about the visual abstract was its popularity outside our traditional audiences. Early on, many visual abstracts were translated to other languages by readers who felt they needed to be spread to non-English audiences. In general, few journals readily translate their articles, and the visual abstract became a gateway to engaging a different audience. The visual abstract was also warmly welcomed by those in the media. It provided a much more concise and accessible summary of the research work to help a reporter identify an author or journal they wanted to contact for an interview on a specific content area. Several times, we noticed the uptake of a research article in the lay press after we released the visual abstract.
The visual abstract will likely continue to evolve and serve journals as an effective strategy to disseminate research. More importantly, its history always provides us with important frameworks, guidance, and safeguards for how future innovations in scientific journals can be harnessed.
References and Links
- https://www.jacc.org/doi/10.1016/j.jacc.2019.10.035
- Ibrahim AM, Bradley SM. Adoption of visual abstracts at Circulation CQO: why and how we’re doing it. Cir Cardiovasc Qual Outcomes. 2017;10:e003684. https://doi.org/10.1161/CIRCOUTCOMES.117.003684.
- Ibrahim AM, Lillemoe KD, Klingensmith ME, Dimick JB. Visual abstracts to disseminate research on social media: a prospective, case-control crossover study. Ann Surg. 2017;266:e46–e48. https://doi.org/10.1097/SLA.0000000000002277.
- Bellini MI, Montserrat N, Naesens M, Neyens T, Schneeberger S, Berney T. The power of online tools for dissemination: social media, visual abstract, and beyond. Transpl Int. 2021;34:1174–1176. https://doi.org/10.1111/tri.13929.
- Brook OR, Vernuccio F, Nicola R, Cannella R, Altinmakas E. Visual abstract for Abdominal Radiology: what it is, why we need it and how to make it. Abdom Radiol (NY). 2021;46:2403–2406. https://doi.org/10.1007/s00261-020-02941-5.
- Iyengar KP, Botchu R, Jain VK, Ish P. Visual abstract: an innovative way to disseminate scientific research. Natl Med J India. 2021;34:374–375. https://doi.org/10.25259/NMJI_586_21.
- Dharnidharka VR. The visual abstract: why, when, what and how. Pediatr Transplant. 2023;27:e14413. https://doi.org/10.1111/petr.14413.
- Baan CC, Dor FJ. The Transplantation Journal on social media: the @TransplantJrnl journey from impact factor to Klout Score. Transplantation. 2017;101:8–10. https://doi.org/10.1097/TP.0000000000001581.
- Wray CM, Arora VM. #VisualAbstract: a revolution in communicating science? Ann Surg. 2017;266:e49–e50. https://doi.org/10.1097/SLA.0000000000002339.
- Castellanos A, Wray CM. The visual abstract: a social media fad or the future of dissemination. Health Info Libr J. 2021;38:245–247. https://doi.org/10.1111/hir.12405.
- Tumpa S, Smith BG, Burton O, Zalocar LAD. Commentary: pearls and pitfalls of visual abstract design. Neurosurgery. 2021;89:E314–E315. https://doi.org/10.1093/neuros/nyab371.
- Klaassen Z, Vertosick E, Vickers AJ, et al. Optimal dissemination of scientific manuscripts via social media: a prospective trial comparing visual abstracts versus key figures in consecutive original manuscripts published in European Urology. Eur Urol. 2022;82:633–636. https://doi.org/10.1016/j.eururo.2022.01.041.
- Lasch DP, Heaton PC. Development of a visual abstract template to enhance journal article circulation on social media. J Am Pharm Assoc. 2022;62:8–9. https://doi.org/10.1016/j.japh.2021.11.026.
- Spicer JO, Coleman CG. Creating effective infographics and visual abstracts to disseminate research and facilitate medical education on social media. Clin Infect Dis. 2022;74(Suppl_3):e14–e22. https://doi.org/10.1093/cid/ciac058.
- Trueger NS, Aly E, Haneuse S, Huang E, Berkwits M. Randomized clinical trial visual abstract display and social media-driven website traffic. JAMA. 2023;330:1583–1585. https://doi.org/10.1001/jama.2023.16839.
- https://www.cdc.gov/genomics/visual/visual_abstract.htm
- https://libraryhub.nejm.org/article-hub/2018/07/visual-abstracts-nejm-articles-now-facebook-twitter/
- https://jamanetwork.com/pages/visual-abstracts
- Oska S, Lerma E, Topf J. A picture is worth a thousand views: a triple crossover trial of visual abstracts to examine their impact on research dissemination. J Med Internet Res. 2020;22:e22327. https://doi.org/10.2196/22327.
- Chisari E, Gouda Z, Abdelaal M, et al. A crossover randomized trial of visual abstracts versus plain-text tweets for disseminating orthopedics research. J Arthroplasty. 2021;36:3010–3014. https://doi.org/10.1016/j.arth.2021.04.006.
- Ibrahim AM. Beyond research dissemination: the unrealized power of visual abstracts to improve health care delivery. Surgery. 2024;175:554–555. https://doi.org/10.1016/j.surg.2023.11.001.
- http://www.surgeryredesign.com/resources
- https://www.linkedin.com/in/chelsea-harris-ccc/
- https://www.researchgate.net/figure/VisualAbstract-https-twittercom-AnnalsofSurgery-status-1062704992904245248_fig29_328503248
- https://www.youtube.com/watch?v=bOXSNCjXAKg
- Howard R, Ibrahim AM. Visual abstracts come of age: it’s time for quality improvement. Ann Surg. 2022;276:e284–e285. https://doi.org/10.1097/SLA.0000000000005542.
- Ibrahim AM. Seeing is believing: using visual abstracts to disseminate scientific research. Am J Gastroenterol. 2018;113:459–461. https://doi.org/10.1038/ajg.2017.268.
- Guidolin K, Lin J, Zorigtbaatar A, et al. Evaluating the accuracy and design of visual abstracts in academic surgical journals. Ann Surg. 2022;276:e275–e283. https://doi.org/10.1097/SLA.0000000000005521.
- Zadro JR, Ferreira GE, Stahl-Timmins W, et al. Development of the Reporting Infographics and Visual Abstracts of Comparative studies (RIVA-C) checklist and guide. [epub ahead of print]. BMJ Evid Based Med. 2024. https://doi.org/10.1136/bmjebm-2023-112784.
Andrew M Ibrahim, MD, MSc, is Vice Chair, Health Service Research; Co-Director, Center for Healthcare Outcomes & Policy; and Director, Design & Health Fellowship; and Visual Abstract Editor, JAMA Network.
Opinions expressed are those of the authors and do not necessarily reflect the opinions or policies of the Council of Science Editors or the Editorial Board of Science Editor.
The views presented here are solely that of my own, and do not necessarily represent those of my institution or journals I have worked with.